Mains: GS I – Indian society
Why in News?
Recently, there is a large gap between real and calculated Total Fertility Rate (TFR) is particularly relevant in a developing country such as India
What is the recent UN report?
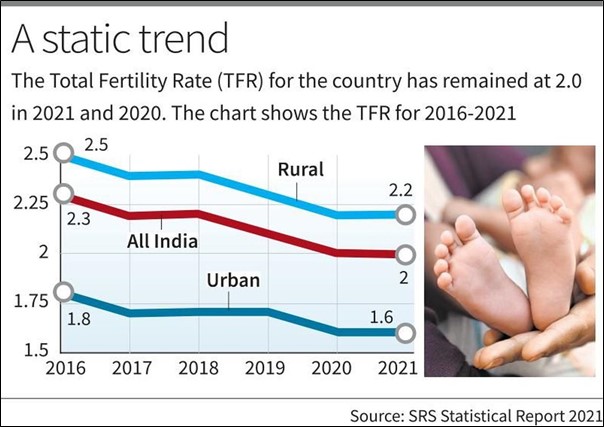
- UN report – The recent United Nations Population Fund’s State of World Population 2025 report shows that India’s current Total Fertility Rate (TFR) has fallen to 1.9.
- Shift of focus – This sub-replacement fertility has shifted the focus of discourse from the belief that rapid population growth is the root of economic backwardness to new concerns about ageing populations.
- Questions raised by UN report – The report brings urgent questions to the forefront.
- Does the methodology used to calculate TFR accurately reflect public perception?
- Could the decline in TFR pose risks to India’s economic trajectory, thereby creating the need to raise the TFR?
What is the perceived meaning of TFR?
- TFR – Total fertility rate (TFR) is the average number of children a woman would have in her lifetime, based on the current age-specific fertility rates.
- However, it is a statistical measure which calculates the average number of children a woman would have in her lifetime if she experienced the current birth rate trends at each age cohorts from 15 to 49 years throughout her reproductive life.
A cohort is a group of people who share a common characteristic, like age or birth year.
- Division of reproductive age – The reproductive age is divided into seven five-year age cohorts of, 15-19, 20-24, 25-29, 30-34, 35-39, 40-44, and 45-49.
- Age specific fertility rate – For each age cohort, the number of live births per 1,000 women in a given year is calculated, this is known as age-specific fertility rate (ASFR).
- These ASFRs are then converted into per-woman figures by multiplying each rate by five (since each cohort covers five years) and dividing by 1,000. Adding up the figures for all seven cohorts gives us the TFR.
- Synthetic cohort assumption – This calculation assumes that that today’s 15–19 age cohort will show fertility patterns similar to today’s 45-49 cohort (or other older cohorts) once they themselves reach that age, and vice versa.
What are the limitations of TFR calculation?
- Assumption vs Reality – Real fertility preferences do not follow the synthetic cohort assumption.
- They often evolve differently, as future younger cohorts are likely to exhibit preferences that differ from those of today’s older women.
- Tempo effect – TFR is a point-in-time measure, which is highly sensitive to a phenomenon known as the tempo effect.
- This refers to changes in the timing of childbearing, not necessarily reduction in the number of births.
- Skipping the postponed births – Since TFR is calculated from the ASFRs of women in a given cohort, births postponed are not captured in that year’s data.
- So the fertility of women who delay childbirth is effectively ‘missed’ even though they may have the same number of children later.
- Thus, tempo effect artificially reduces the TFR and gives a false impression of lower fertility.
- The phenomena exacerbates when birth postponement takes place in the majority of the younger age cohorts.
- Interestingly, today’s postponement will overestimate future TFR calculation.
- This large gap between real and calculated TFR is particularly relevant in India, which is simultaneously undergoing economic, social, and cultural transitions.
- These include rising female literacy and a more career-oriented outlook among women that creates a stronger incentive to delay childbirth.
- Exclusion – TFR excludes births to women below 15 and above 49, based on the assumption that such cases are negligible.
- This assumption is less valid in developing and Islamic countries where early marriages are common.
- Owing to legal and social sensitivities, births to underage girls are often concealed.
- Skipped questions – Moreover, survey enumerators may also avoid uncomfortable questions, as noted in the 2020 DHS Methodological Report.
- The ASFR trends presented reflect a shift in childbirth patterns, with fertility being postponed from younger to older cohorts.
- Urban areas – In urban areas, the decline in the share of ASFR among the youngest two cohorts (15-19 and 20-24) and the corresponding increase across the older cohorts (25-29 to 45-49) strongly indicates a postponement of fertility preferences rather than an overall decline in fertility.
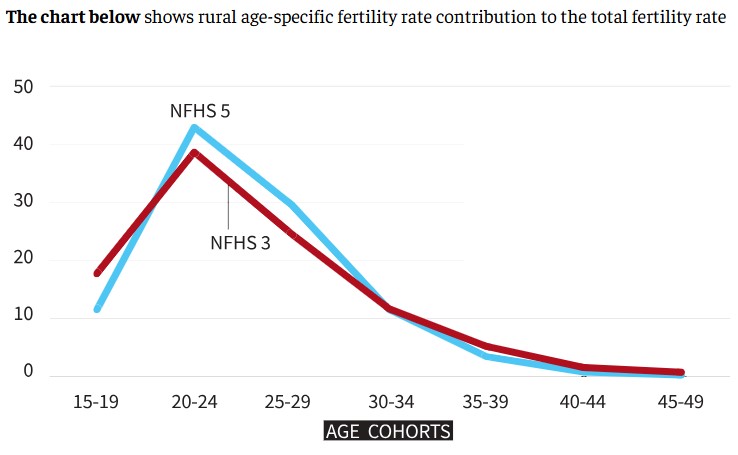
- Rural areas – In rural areas, a decline in the share of ASFR is observed in the 15-19 age cohorts, along with an increase in the 20-24 to 30-34 age cohorts.
- This also suggests a postponement of fertility preferences.
- However, unlike in urban areas, this shift is largely confined to the middle age cohorts.
- The declining share of older cohorts (35-39 and above) points to a reduction in fertility preference in these age cohorts.
What lies ahead?
- Given these problems, and amid growing calls to raise the TFR due to concerns over ageing population, it is important to recognise that historically, sub-replacement fertility has not constrained economic progress, as evidenced in Europe, the U.S., and several newly industrialised economies.
- Moreover, India has missed the opportunity to fully harness its demographic dividend, constrained by persistent youth unemployment, a challenge likely to intensify with automation and AI.
- More importantly, the current size of the elderly population remains largely independent of present fertility trends.
- While caring for the ageing population is a moral responsibility of the state, its urgency does not automatically increase simply because of a reported decline in TFR.
Reference
The Hindu| Total Fertility Rate of India