From Awareness to Action for Cleaner Air
Why in News?
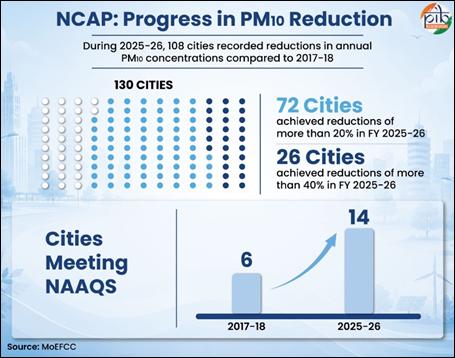
The National Clean Air Programme (NCAP) covers 130 cities.
In FY 2025–26, 108 cities recorded lower PM10 levels compared with 2017–18. Of these, 72 cities achieved more than 20% reduction, while 26 cities achieved more than 40% reduction.
Air Pollution?
Major Sources
Particulate Matter
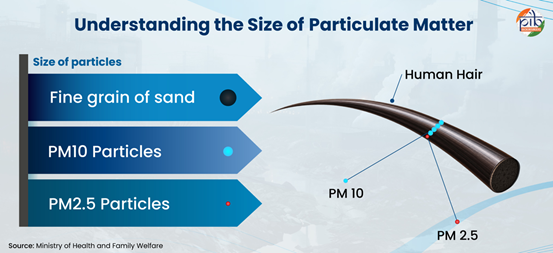
Particulate Matter (PM) is one of the most important air pollutants.
Air pollution can lead to respiratory and cardiovascular diseases.
It can also affect children, elderly people and other vulnerable groups.
It damages ecosystems and can reduce productivity and economic well-being.
India’s Approach to Clean Air
The overall approach focuses on:
Monitoring → Identifying pollution sources → Controlling emissions → City-specific action → Continuous assessment
Air Quality Monitoring in India
National Air Quality Monitoring Programme (NAMP) was initiated by the CPCB to assess the status and trends of ambient air quality.
Its objectives include:
As of March 2026, India has 1,646 monitoring stations across 603 cities in 28 States and 7 UTs.
The network includes both manual and real-time monitoring stations.
SAMEER
The SAMEER mobile application and web portal provide near-real-time AQI information for more than 292 cities. It improves public awareness and transparency.
Major Air-Quality Monitoring Systems
CAAQMS –
Continuous Ambient Air Quality Monitoring System (CAAQMS) provides automated and real-time information about ambient air quality.
It monitors pollutants such as:
AAQMS
Ambient Air Quality Monitoring System (AAQMS) includes both manual and automated monitoring. Manual monitoring involves collecting air samples and analysing them in laboratories.
OCEMS
Online Continuous Emission Monitoring System (OCEMS) monitors emissions directly from industrial units. It continuously sends data to regulatory authorities and helps check compliance with emission standards.
Air Quality Index
The Air Quality Index (AQI) converts complex pollution data into a simple number that citizens can understand.
It considers eight major pollutants:
PM10, PM2.5, NO₂, SO₂, CO, O₃, NH₃ and Lead.
|
AQI |
Category |
|
0–50 |
Good |
|
51–100 |
Satisfactory |
|
101–200 |
Moderate |
|
201–300 |
Poor |
|
301–400 |
Very Poor |
|
401–500 |
Severe |
The overall AQI reflects the pollutant showing the worst level of pollution.
National Clean Air Programme
The National Clean Air Programme (NCAP) was launched in 2019 to address urban air pollution in mission mode.
It covers 130 cities and promotes city-specific and source-specific clean-air action plans.
Key Achievements
Digital Tracking and City Performance
PRANA Portal
PRANA tracks the physical and financial progress of NCAP. It improves transparency and helps governments monitor city-level clean-air action plans.
Swachh Vayu Survekshan
It is an annual assessment of NCAP cities. It encourages cities to compete, innovate and improve their air-quality management.
In 2025, Indore, Amravati and Dewas topped the three city categories.
In 2026, Lucknow, Rourkela and Kalinganagar topped the three categories.
Ward-level assessments have also been introduced to promote a bottom-up approach.
Sector-Wise Measures
India introduced BS-VI emission standards from April 2020.
Other measures include:
These measures aim to reduce emissions and promote cleaner mobility.
B. Industrial Pollution
The Government has prescribed emission standards for industrial sectors.
CPCB has classified 419 industrial sectors and sub-sectors based on their pollution potential.
Highly polluting industries are required to install OCEMS. Industries are also being encouraged to use cleaner fuels and pollution-control devices.
State Pollution Control Boards are responsible for monitoring and enforcing environmental standards.
C. Road Dust and Construction
Road and construction dust is an important source of PM10 pollution.
Measures include:
D. Waste Burning
The Government is strengthening waste-management rules to reduce open burning.
Extended Producer Responsibility (EPR) encourages producers to manage post-consumer waste. Recycling and scientific waste processing can reduce landfill pressure and pollution.
E. Crop-Residue Burning
The Government is promoting alternatives to stubble burning.
Measures include:
Between 2018–19 and 2025–26, ₹4,233.84 crore was provided for crop-residue management.
In 2025, stubble-burning incidents declined by 93% in Punjab and 91% in Haryana compared with 2021.
Afforestation and Green Cover
Green spaces can improve environmental quality and strengthen ecological resilience.
Major Initiatives
Institutions for Clean Air
CPCB
The Central Pollution Control Board is the main national pollution-control body. It monitors pollution and supports the implementation of environmental standards.
CAQM
The Commission for Air Quality Management (CAQM) coordinates air-pollution control in Delhi-NCR and coordinates GRAP implementation.
SPCBs
State Pollution Control Boards monitor industries, enforce environmental regulations and control pollution at the State level.
Graded Response Action Plan
GRAP is an emergency response mechanism for worsening air quality in Delhi-NCR.
It uses AQI levels, forecasts and scientific assessments to introduce progressively stronger measures.
|
Stage |
AQI |
|
Stage I – Poor |
201–300 |
|
Stage II – Very Poor |
301–400 |
|
Stage III – Severe |
401–450 |
|
Stage IV – Severe+ |
Above 450 |
Measures can include restrictions on construction, industries and certain vehicles.
Key Challenges
Despite progress, several challenges remain:
Way Forward
India needs to move from reactive pollution control to preventive and science-based management.
Key priorities should include:
Reference