PIB Analysis
Powering India’s Clean Energy Transition
Types of Energy Storage
|
Feature |
BESS |
PSPs |
|
Main role |
Short-duration storage and rapid grid response |
Long-duration, large-scale storage |
|
Applications |
Frequency regulation, peak management and grid balancing |
Renewable energy integration, peak demand and grid stability |
|
Deployment |
Relatively quick and flexible |
Requires suitable geography and infrastructure |
|
Operating life |
Generally shorter |
Long operational life |
Both technologies complement each other in ensuring reliable electricity supply.
Understanding PSPs: Cycle of Energy Storage and Supply
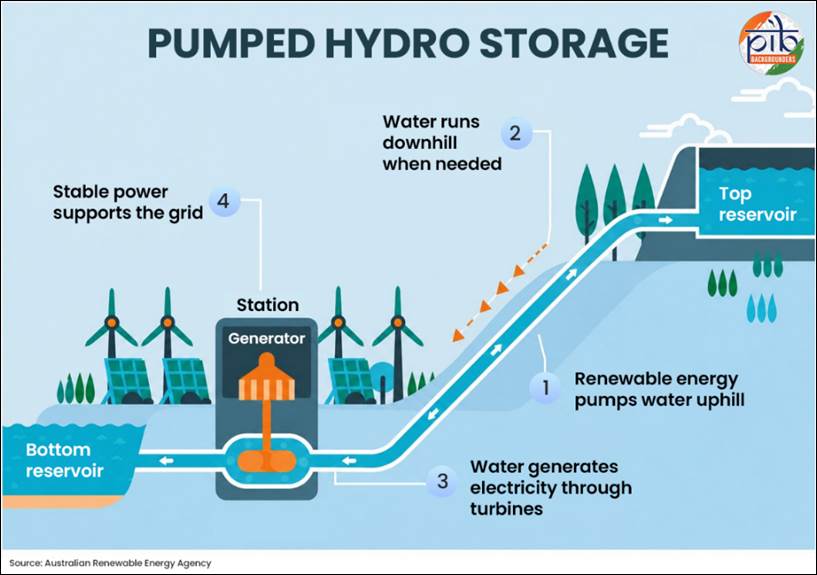
Thus, PSPs function as large-scale water batteries.
Categorising Pumped Storage Power Plants
PSPs are classified according to their connection with natural watercourses.
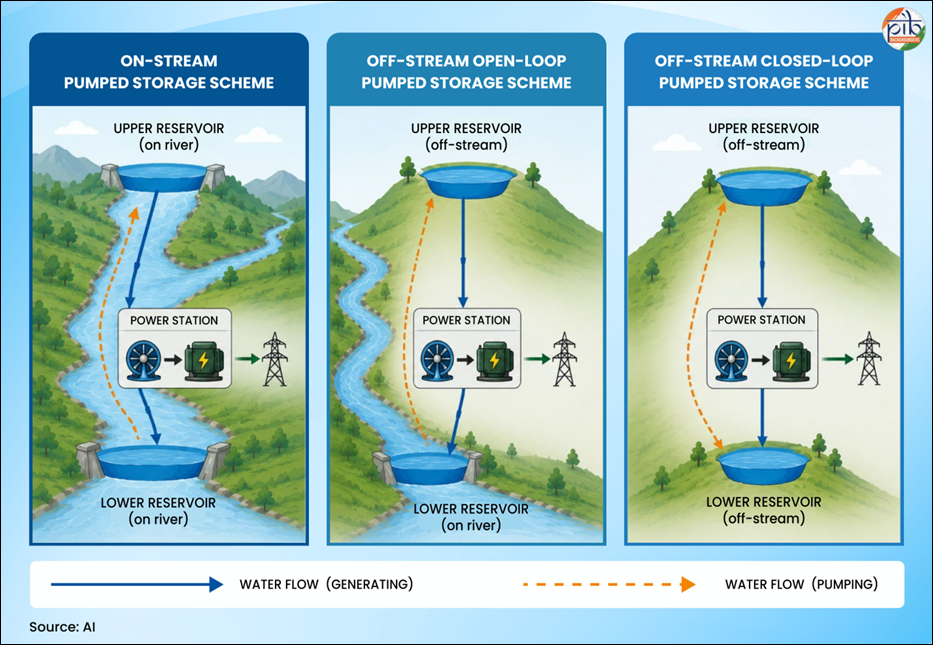
A. On-stream Pumped Storage
B. Off-stream Open-loop Pumped Storage
C. Off-stream Closed-loop Pumped Storage
Significance: Off-stream projects are increasingly being explored to accelerate development and minimise impacts on rivers and aquatic ecosystems.
Scaling Up Energy Storage: India’s Pumped Storage Momentum
As of August 2026, India's PSP development pipeline includes:
|
Development stage |
Capacity |
Projects |
|
Operational |
7.43 GW |
10 |
|
Under construction/implementation |
15.87 GW |
11 |
|
Concurred/appraised by CEA |
10.40 GW |
8 |
The expanding pipeline will strengthen India's long-duration energy storage capacity.
India’s Regionally Diverse Pumped Storage Potential
India has identified 320 PSPs with a combined potential of 345.38 GW.
Regional potential
|
Region |
Potential |
Key States |
|
Western |
129.72 GW |
Maharashtra (67.36 GW), Gujarat (33.36 GW) |
|
Southern |
97.76 GW |
Andhra Pradesh, Telangana, Tamil Nadu |
|
Eastern |
53.41 GW |
Odisha (41.53 GW) |
|
Northern |
50.32 GW |
Uttar Pradesh, Himachal Pradesh |
|
North Eastern |
14.18 GW |
North-Eastern States |
|
Total |
345.38 GW |
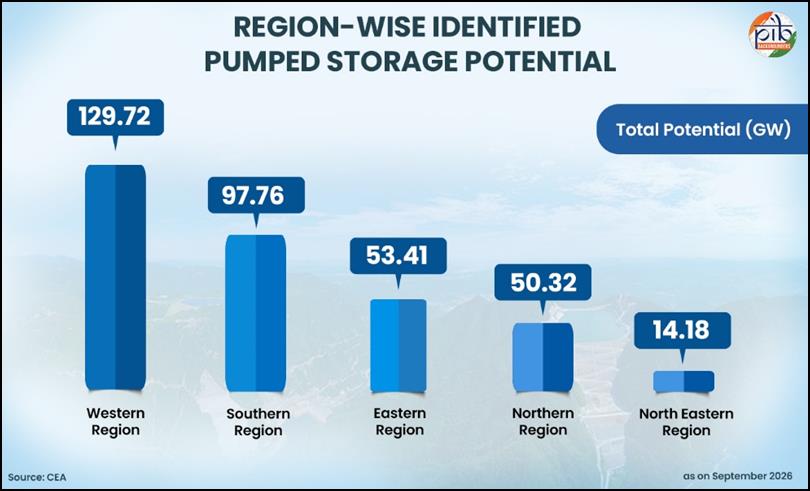
Site assessment factors: Topography, geology, hydrology, reservoir characteristics, foundation conditions, seismicity, environmental impacts, construction materials, power potential and transmission connectivity.
Projected Capacity Addition of PSPs
The CEA envisages 100.81 GW of additional PSP capacity by 2035–36, taking cumulative capacity to approximately 105.56 GW.
|
Year |
Addition (GW) |
Cumulative capacity (GW) |
|
Up to 2024–25 |
— |
4.745 |
|
2025–26 |
2.68 |
7.425 |
|
2026–27 |
2.92 |
10.345 |
|
2027–28 |
1.60 |
11.945 |
|
2028–29 |
6.35 |
18.295 |
|
2029–30 |
13.50 |
31.795 |
|
2030–31 |
21.19 |
52.985 |
|
2031–32 |
8.80 |
61.785 |
|
2032–33 |
14.59 |
76.375 |
|
2033–34 |
11.88 |
88.255 |
|
2034–35 |
5.70 |
93.955 |
|
2035–36 |
11.60 |
105.555 |
The planned expansion will improve grid flexibility and support greater renewable energy integration.
Global Installed Capacity of PSPs
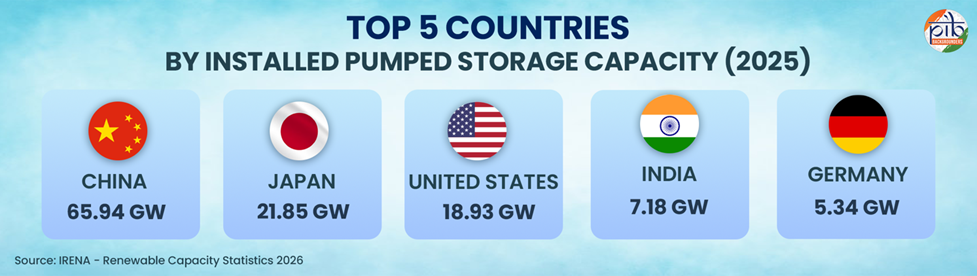
According to IRENA, global installed pumped hydro capacity reached 159.8 GW at the end of 2025.
|
Country |
Installed capacity (approx.) |
|
China |
66 GW |
|
Japan |
22 GW |
|
United States |
19 GW |
|
India |
7.18 GW |
India ranked fourth globally at the end of 2025. Its capacity increased to 7.43 GW by 2026.
Government Initiatives and Measures
Energy Transition’s Next Imperative
Conclusion
Pumped Storage Hydropower will be a key pillar of India’s clean energy transition by providing long-duration storage, improving grid reliability and supporting the 2030 target of 500 GW of non-fossil fuel capacity.
Reference