0.3318
7667766266
x

Relative Economic Performance of Indian States

iasparliament Logo
September 19, 2024

Why in news?

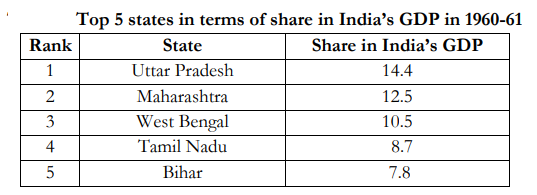
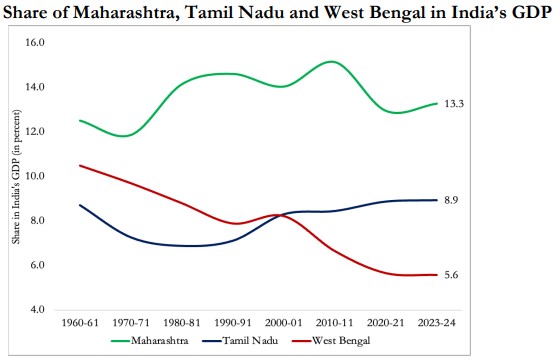
Recently, Economic Advisory Council to the Prime Minister (EAC-PM) has released the paper ‘Relative Economic Performance of Indian States: 1960-61 to 2023-24’.

How has the regional growth changed from 1960 to 2023?

  • In the 1960s, five states, Uttar Pradesh, Maharashtra, West Bengal, Tamil Nadu and Bihar, accounted for about 54 per cent of India’s GDP.

regional disparities

  • Interregional Disparities - Western and Southern regions of India have performed notably better than other parts of the country from 1960-61 to 2023-24.

disparities 2

  • Intraregional Disparities – Within each region, disparities have emerged amongst the States.
  • Maharashtra, Gujarat, Delhi and Haryana have shown steady performance over the last six decades.

Regional Growth (1960-2023)

Southern Region

  • Southern States - Karnataka, Andhra Pradesh, Telangana, Kerala and Tamil Nadu.
  • Since the economic liberalization of 1991, southern States have emerged as the leading performers.
  • They now collectively account for approximately 30% of India’s GDP in 2023-24.
  • Kerala - Only southern state which saw its share in the GDP dip.
  • It’s share increased from 3.4 % in 1960-61 to a peak of 4.1 % in 2000-01, then dipped to 3.8 per cent in 2023-24.

Western Region

  • Maharashtra and Gujarat – Their per capita incomes remained above the national average since the 1960s.
  • In 2023-24, They account for 160.7 % and 150.7 % of the national average.
  • Goa – Its relative per capita income has doubled over the period.

Eastern Region

  • West Bengal – It was the third-largest in 1960-61 with 10.5% of National GDP.
  • It has now declined to only 5.6 % in 2023-24.
  • Odisha – Its relative per capita income increased from 55.8 % in 2000-01 to 88.5 % in 2023-24.
  • Bihar – Its relative position has stabilized in the last two decades; it remains significantly behind other states.


Northern Region

  • Delhi - The Capital had the highest per capita income in 1960-61 at 218.3 per cent of the national average.
  • In 2023-24, Delhi’s relative per capita income was 250.8 per cent.
  • Punjab – Its per capita income was 106.7 % of the national average in 2023-24, down from 119.6 % in 1960-61.
  • Haryana – Its relative per capita income stood at 176.8 % in 2023-24, up from 106.9 % in 1960-61.

Central Region

  • Uttar Predesh - In the 1960s, It was largest economic powerhouse in the country with a share of 14.4 % in India’s GDP.
  • Madhya Pradesh - Its relative per capita income has risen since 2010, following a five-decade period of decline since 1960s.

What are the causes of regional disparities?

  • Green Revolution - Punjab and Haryana gained from rise in income levels after the green revolution in the 1960s.
  • Punjab did not keep pace with the national average and its economic trajectory diverged completely from Haryana.
  • Economic Liberalization - Before 1991, southern States did not show exceptional performance.
  • However, since the economic liberalization of 1991, southern States have emerged as the leading performers
  • Historical Factor - Three presidency towns—Bombay, Calcutta, and Madras—were home to the largest industrial clusters in the country.
  • State Reorganization – Bifurcation of states had reduced the resources available to them and their collective share to the national growth.
  • Policies – State-specific policies on socio economic spheres and Performance of individual States in response to changes in national policies.

What lies ahead?

  • Create policies that are tailored to the needs of different regions and that promote equality of opportunity.
  • Provide fiscal support to lagging regions and ease worker relocation.
  • Improve the quality of education and training to help people adapt to changing job markets.
  • Decentralize industries to encourage balanced regional development.
  • Promote local economies so that all regions benefit from economic activity.
  • Improve connectivity through transport links, access to finance, and cooperation with universities and research centers.

Quick Facts

  • State share in national GDP - It is defined as ratio of state’s Gross State Domestic Product (GSDP)1 to sum of GSDP of all states.
  • This gives an idea of relative economic importance of states.
  • Relative per capita income - It is defined as percentage of per capita Net State Domestic Product (NSDP) of the state to the all-India per capita Net National Product (NNP) or per capita Net National Income (NNI).

References

  1. The Hindu | EAC-PM paper
  2. The Indian Express | Steady growth in west, south states
  3. EACPM | Relative Economic Performance of Indian States Report
2 comments
Login or Register to Post Comments

Pihu Service 3 days

Finding dependable companionship services in a large city like this can be not too simple, especially for tourists and business people who want comfort, privacy, and convenience. There are lots of websites today offering verified profiles, secure messaging, and flexible bookings to make the process easier and safer. If you are looking for Cheap Escorts in Bangalore, it is essential to work with reputable agencies or websites that are professional and respect your privacy.

Riya Nayar 13 days

To maximise your experience with a Delhi escort, it is important to engage in conversation and to share your interests in order to generate a positive bond between you and your Escort in Delhi, and also to appreciate their company.


ARCHIVES

MONTH/YEARWISE ARCHIVES

sidetext
Free UPSC Interview Guidance Programme
sidetext