Prelims: Current events of national and international importance | Economy
Why in News?
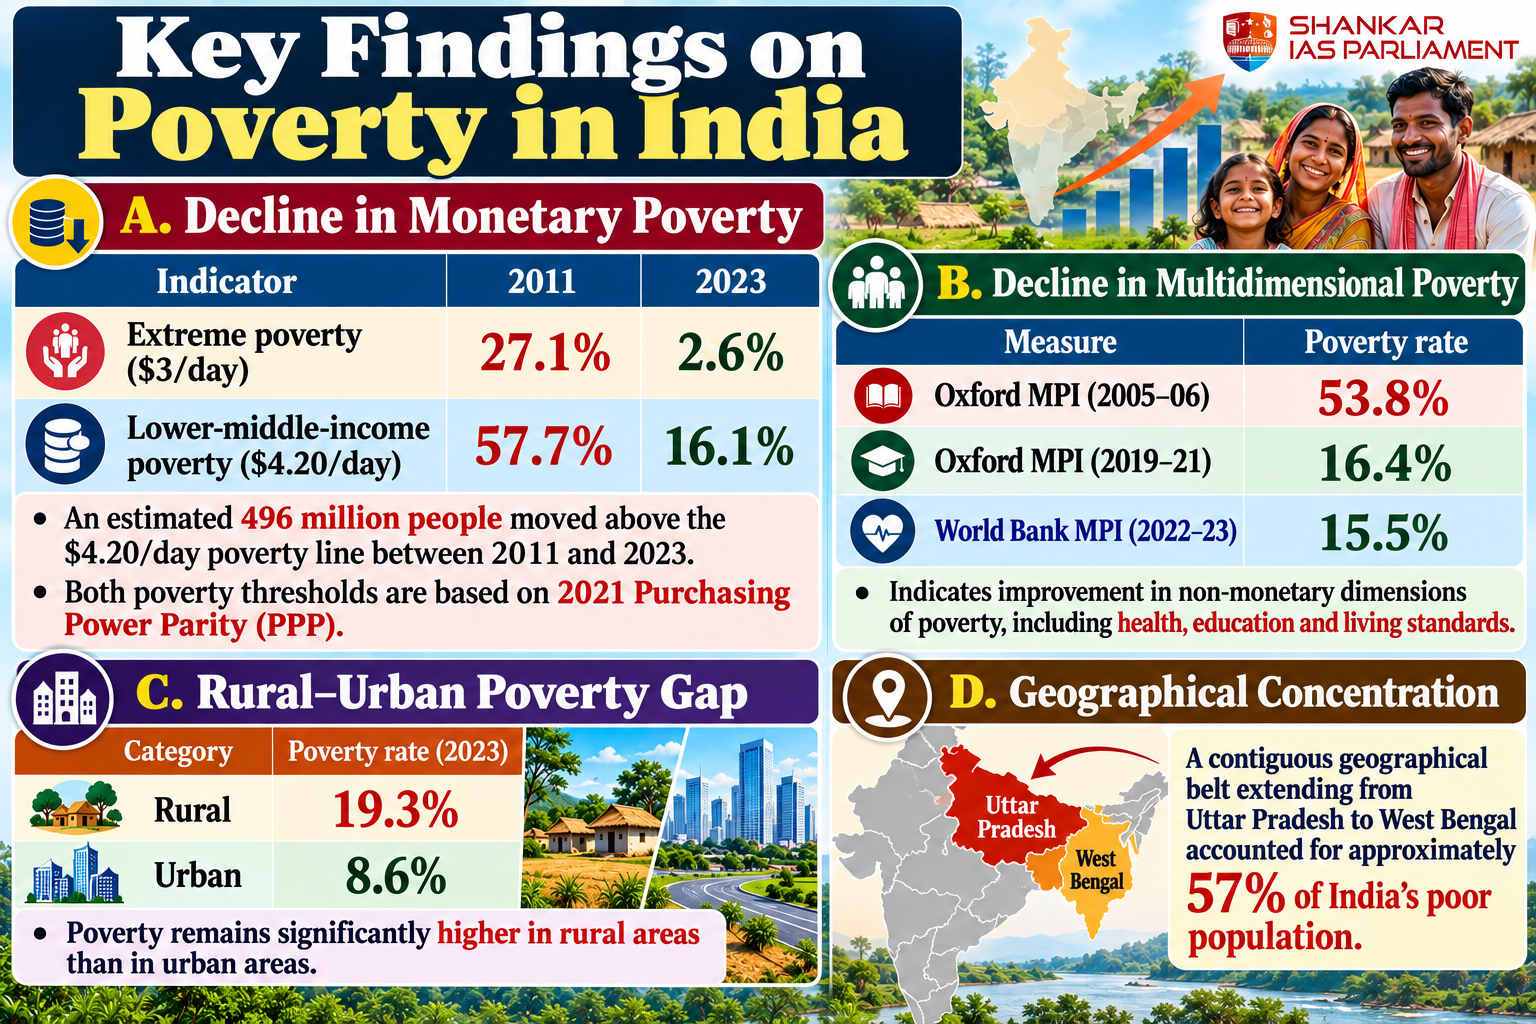
The World Bank's October 2026 Poverty & Equity Brief reports that India's extreme poverty rate declined significantly from 27.1% in 2011 to 2.6% in 2023.
- Despite this reduction in extreme poverty, income disparities remain pronounced, as the median earnings of the top 10% of workers are approximately 13 times higher than those of the bottom 10%.
Key Determinants of Poverty Reduction
- Economic Growth – Expansion of income-generating opportunities and enhancement of household purchasing power.
- Consumption Growth – Rise in household consumption expenditure.
- Employment Generation – The workforce expanded by approximately 134 million individuals between 2017 and 2023.
- Women's Workforce Participation – Greater involvement of rural women in paid employment.
- Social Protection – Broader coverage of social transfers, such as food subsidies.
Employment Trends and Key Concerns
- Employment Growth
- Between 2017 and 2023, employment increased by approximately 134 million individuals.
- This employment growth was nearly double the increase observed in the working-age population.
- A significant portion of this increase resulted from rural women entering paid employment.
- Major Employment Concerns
- Stagnant Earnings – Real earnings remained largely unchanged during this period.
- Low Productivity – Most employment growth occurred in sectors characterised by relatively low productivity.
- Rising Youth Unemployment
- In the first quarter of FY2026, the youth unemployment rate was 14.6%.
- In the first quarter of FY2027, this rate increased to 15.9%.
- Rural young women were disproportionately affected by rising unemployment.
Income Inequality in India
- Gini Index – According to the World Bank, India's Gini index was 23.0 in 2023.
- The Gini index measures inequality in the distribution of income or consumption.
- Wage Inequality – In 2023, the median earnings of the top 10% of workers were approximately 13 times higher than those of the bottom 10%.
- For example, if the bottom 10% of workers earn ₹1,000, the top 10% would earn ₹13,000 at their respective median earnings.
Reference
Indian Today | Poverty and Inequality in India