Why in news?
Newly released provisional estimates show GDP rose 8.7% in 2021-22.
What is the growth estimate for FY2022?
The GDP measures the value of all final goods and services (those that are bought by the final user) produced in a country in a given period.
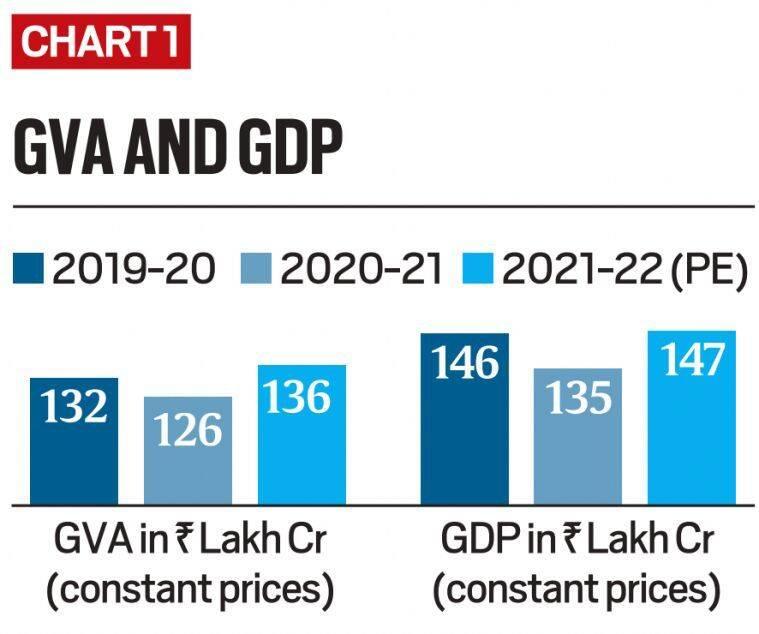
- GDP growth- According to the provisional estimates released by the Ministry of Statistics and Programme Implementation, India’s gross domestic product (GDP) grew by 8.7% in 2021-22.
- This growth comes at the back of a 6.6% contraction in GDP during 2020-21 when the pandemic led to massive disruptions and widespread lockdowns.
- GVA growth- The data released also showed that the Gross Value Added (or GVA) grew by 8.1% in FY22.
- In FY21, GVA had contracted by 4.8%.
- At the aggregate level, the economy has recovered all the lost ground due to the contraction in FY21.
How are GDP and GVA different?
- While the GDP calculates national income by adding up all expenditures in the economy, the GVA looks at the value added in each sector of the economy.
- GDP provides the demand side of the economy, and GVA the supply side.
- If the government earned more from taxes than it spent on subsidies, GDP will be higher than GVA.
- If the government provided subsidies in excess of its tax revenues, the absolute level of GVA would be higher than that of GDP.
GDP = GVA + Taxes earned by the government — Subsidies provided by the government
What do the GDP data show?
- GDP has four engines of growth in any economy - Private final consumption expenditure (PFCE), Gross fixed capital formation (GFCF), Government final consumption expenditure (GFCE) and Net exports (NX).
- PFCE- In India’s case, the biggest engine is private consumption demand from individuals that accounts for 56% of all GDP.
- GFCF- The money spent by companies and government towards making investments such as building a new office, buying a new computer or building a new road etc. accounts for 32% of all GDP in India.
- GFCE- The money spent by the government towards its day-to-day expenses such as paying salaries accounts for 11% of India’s GDP.
- NX- It is the money spent by Indians on foreign goods (imports) subtracted from the money spent by foreigners on Indian goods (exports).
- Since in most years India imports more than it exports, the NX is the smallest engine of GDP growth and is often negative.
- While the government’s expenditures are more than 6% higher than FY20 levels, investments are up less than 4% and private demand is just 1.4% above the FY20 level.
GDP = PFCE + GFCF + GFCE + NX
What do the GVA data show?
- Overall GVA was almost 3% more than the FY20 level.
- Agriculture and allied sectors never contracted and continued to grow through the last two years.
- Manufacturing is up over 9% from pre-Covid levels.
- Mining and construction either show a moderate increase or a deficit and contact-intensive services such as trade and hotel etc. are still more than 11% below pre-Covid levels.
What is the key takeaway from the report?
- India’s economy has at least on aggregate parameters gone past pre-Covid levels.
- However, this recovery is neither uniform nor broad-based, and has created its own set of winners and losers.
- This so-called “K-shaped” recovery shows that even though at the aggregate level both GDP and PFCE have crossed the pre-Covid level, the average Indian hasn’t yet recovered.
- This is a recovery only when compared to the pre-Covid level and not to what would be the pre-Covid growth trajectory.
- Growing geopolitical uncertainties, rising crude oil prices, tightening of monetary conditions etc. are likely to dampen the growth private consumption demand.
Reference
- https://indianexpress.com/article/explained/india-gdp-data-provisional-estimates-covid-pandemic-lockdown-explained-7946558/