Why in news?
The World Meteorological Organization (WMO), the UN's weather agency, released its annual report, State of the Global Climate in 2018.
What are the highlights?
- Climate indicators - The report highlighted the worsening impact of climate change across the world.
- It showed how the world was degenerating on key climate indicators.
- These include the following:
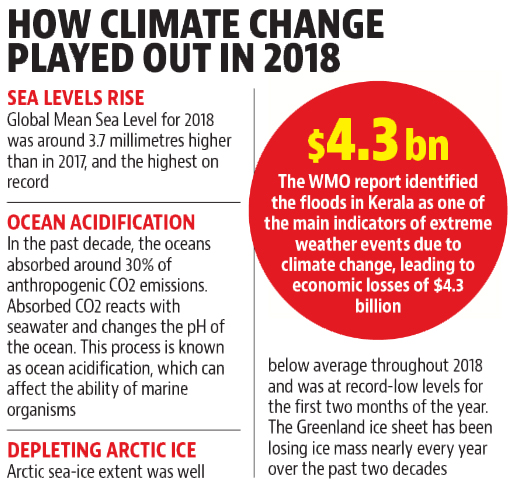
- sea levels rose at a record pace last year
- vast ocean stretches continued to become acidic
- very high land and ocean temperatures over the last 4 years
- most monitored glaciers are retreating
- Emissions - All of the above are linked to the rising anthropogenic carbon dioxide (CO2) emissions.
- The CO2 levels, were at 357 parts per million (PPM) when the WMO statement was first published in 1994.
- It kept rising to reach 405.5 PPM in 2017, and is expected to increase even further in 2018 and 2019.
- Extreme weather events - WMO underlined the extreme weather events experienced all over the world in 2018.
- This included the severe flooding in Kerala in August 2018, which led to economic losses estimated at $4.3 billion.
- Rainfall in Kerala in August was 96% above the long-term average.
- A cold wave also affected parts of India; 135 deaths in just 10 ten days in January in Uttar Pradesh were attributed to cold.
What are the notable climate change impacts?
- Warming - 2018 was ranked among the top 10 warmest years in Africa, Asia, Europe, Oceania and South America.
- Sea-surface waters in a number of oceans were unusually warm in 2018, including much of the Pacific.
- The greatest rates of ocean warming were seen in the southern ocean, with warming reaching the deepest layers.
- In November 2017, a marine heat wave developed in the Tasman Sea (in South Pacific Ocean between Australia and New Zealand) and persisted until February 2018.
- Sea-surface temperatures in the Tasman Sea exceeded 2 °C above normal, setting a record.
- Ocean acidification - As ocean acidification rises, marine biodiversity is at a major risk.
- Since the middle of the last century, there has been an estimated 1%-2% decrease in the global ocean oxygen inventory.
- Hundreds of sites are known to have experienced oxygen concentrations that impair biological processes or are lethal for many organisms.
- Sea level - The global mean sea level for 2018 was around 3.7 mm higher than in 2017 and the highest on record.
- Rapid ice mass loss from ice sheets is the main cause of the global mean sea-level rise.
- Arctic sea-ice extent was significantly below average throughout 2018.
- The report referred to monitoring of glacier mass-balance by the World Glacier Monitoring Service for 19 mountain regions.
- It noted that 2017-18 was the 31st consecutive year of negative mass balance for the glaciers monitored.
- This refers to glaciers losing more mass than they receive.
- Rainfall - Although weak La Nina conditions were noticed at the beginning of 2018, the effect on precipitation was the opposite of what had been expected.
- E.g. several floods occurred in California, an unexpected event during La Nina
- The Indian monsoon brought less rainfall than normal to the Western Ghats and the eastern parts of the Himalayas, but higher than normal in the Western Himalayas.
- The all-India rainfall for June to September 2018 was around 9% below the long-term average.
- In all, the report calls for urgent support to poor people and countries in tackling climate impacts that are forcing millions out of their homes.
- Rich countries must lead the transition to a greener economy and assist developing countries to follow suit.
Source: Hindustan Times