0.1477
7667766266
x

Annual Survey of Industries (ASI), 2024-25

iasparliament Logo
November 11, 2026

Prelims: Current events of national and international importance | Economy

Why in news?

A detailed Annual Survey of Industries (ASI) 2024-25 was released recently.

  • Released by – Ministry of Statistics and Programme Implementation (MoSPI).
  • Objective – To provide a meaningful insight into the dynamics of change in the composition, growth and structure of various manufacturing industries in terms of output, value added, employment, capital formation and a host of other parameters.
  • It provides valuable input to the National Accounts Statistics at the national and state levels.
  • Methodology & Legal Framework – Conducted by the National Statistical Office (NSO) under the Collection of Statistics Act, 2008 (amended in 2017) and the Collection of Statistics Rules, 2024.
  • Coverage – The survey covers the financial year from April 2024 to March 2025, with fieldwork conducted between October 2025 and June 2026, covering a sample of 86,547 units drawn from a frame of 2,68,778 establishments across registered factories, bidi/cigar units, and non-CEA electricity undertakings.

Key findings

  • Gross Value Added (GVA)
  • Corporate Dominance – The corporate manufacturing segment accounts for over 89% of total manufacturing GVA and recorded 9.28% growth in GVA in 2024–25, with NVA per operational factory rising by 6.59%.
  • More factories & Jobs – Recorded a 3.45% increase in operating factories and 7.57% growth in persons engaged.
  • GVA per person engaged increased 2.25% over the previous year, while the gross value of plant and machinery in the registered manufacturing sector grew 7.25%.
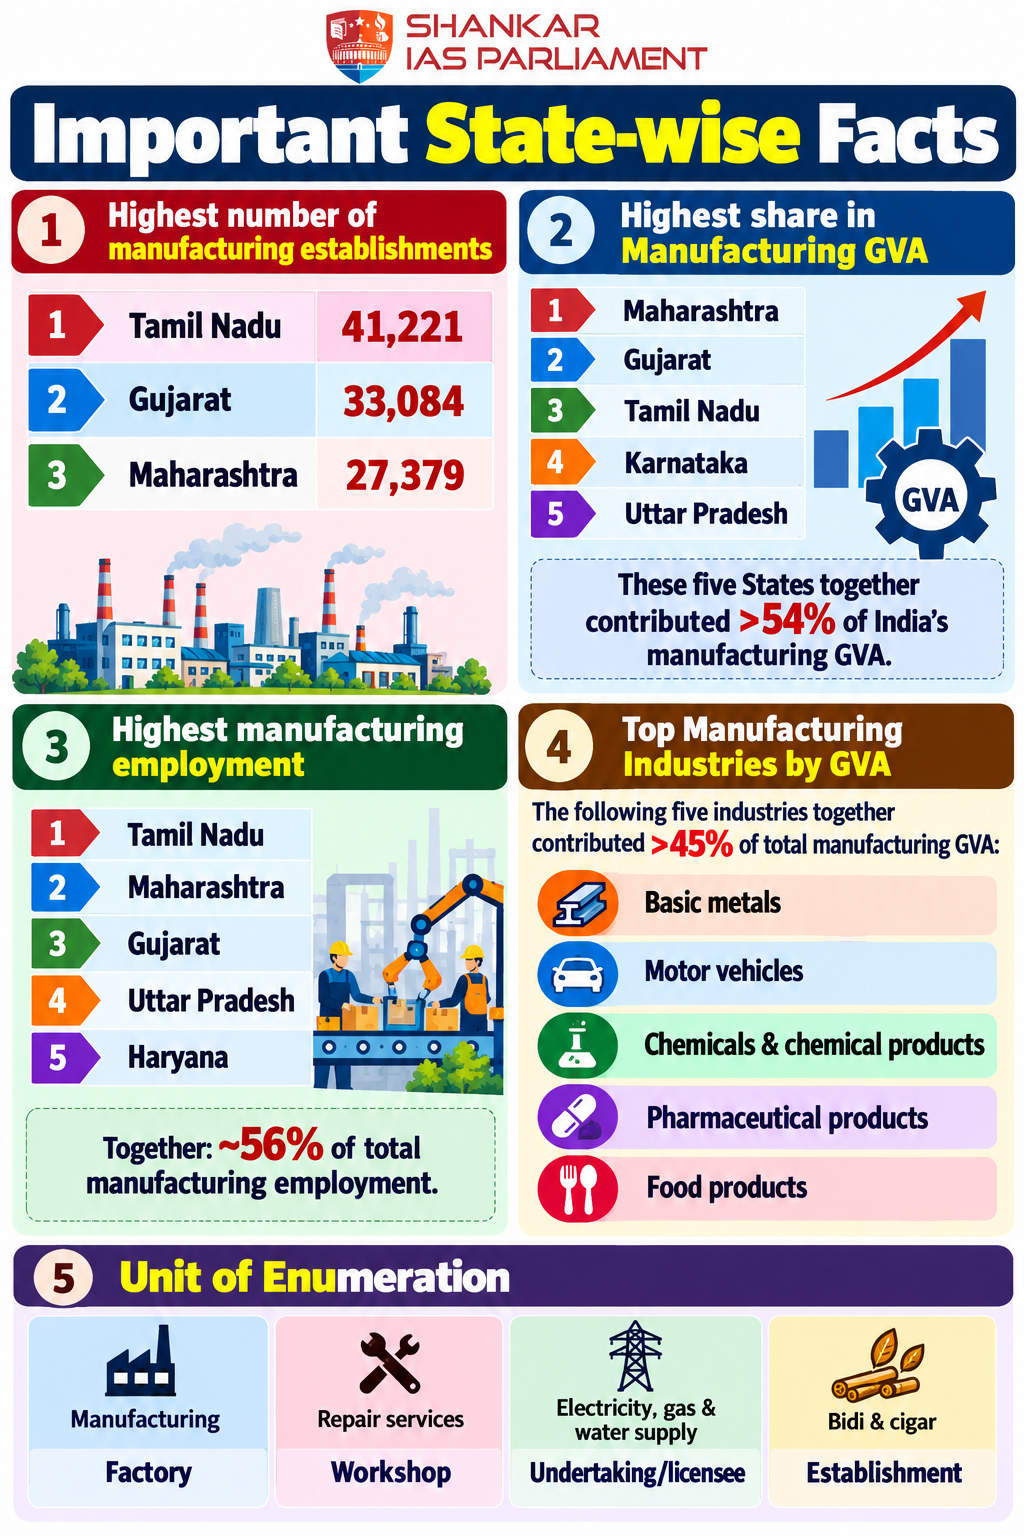
  • Top 5 States by GVA (>54% of national total) – Maharashtra (15.92%), Gujarat, Tamil Nadu, Karnataka, and Uttar Pradesh.
  • Top 5 Industries by GVA (>45% of total) – Basic metals, motor vehicles, chemicals and chemical products, pharmaceutical products, and food products.
  • Employment
  • Top 5 States (>56% of total workforce) – Tamil Nadu (31.4 lakh), Maharashtra (27.4 lakh), Gujarat (27.2 lakh), Uttar Pradesh, and Haryana.
  • Top 5 Industries (>41% of total) – Food products (which also holds the largest share of factories at 16.19%), textiles, basic metals, motor vehicles, and wearing apparel.
  • Scale Disparity – Small factories (with plant and machinery investment up to Rs. 5 crore) make up 78.69% of all operating units and employ 34.32% of the workforce, yet generate only 17.61% of Net Value Added (NVA).
  • Conversely, large capital-intensive factories (plant and machinery worth Rs. 10 crore or more) represent just 15.84% of units but produce 78.07% of NVA.

state-wise-manufacturing-facts-infographic.png.upsc

Reference

DD News | Manufacturing corporate sector GVA grows 9.28% in 2024–25: Annual Survey of Industries

There are no reviews yet. Be the first one to review.

ARCHIVES

sidetext