Mains: (GS-II) Issues relating to poverty and hunger
Why in news?
Recently, World Bank updated its extreme poverty threshold to $3/day (2021 prices) from $2.15/day (2017 prices) to account for global inflation and released a revised estimate on India’s poverty rate.
What is the World Bank's International Poverty Line (IPL)?
- International Poverty Line (IPL) – The World Bank introduced the International Poverty Line (IPL) in 1990 to enable cross-country comparisons using Purchasing Power Parity (PPP).
- According to world bank the poverty line is defined as the minimum level of spending required to meet basic needs like food, clothing, and shelter.
- Purpose of the IPL – The IPL adjusts for price level differences between countries using PPP.
- Initially IPL was set at $1/day (1985 PPP), revised over the years with inflation and updated PPPs.
What changes were made in poverty line?
- Updated IPL – It improved measurement of consumption, particularly food and non-food items.
- The integration of 2021 purchasing power parity (PPP) estimates.
- The poverty rates were categorized into three based on income levels.
- Extreme Poverty (Low-Income Countries) – Raised from $2.15 to $3/day).
- Lower-Middle-Income Countries (LMIC) – Raised from $3.65 to $4.20/day.
- Upper-Middle-Income Countries (UMIC) – Raised from $6.85 to $8.40/day.
- Reason for revision – It reflects updated price data, improved consumption surveys, and changes in national poverty lines.
- It also provides a more accurate and stringent measure of poverty.
- Impact of revision globally – The global poverty rate for 2022 increased from 9% to 10.5%.
- Additional 125 million people worldwide classified as poor under the new threshold.
How has India’s poverty rate changed under new methodology?
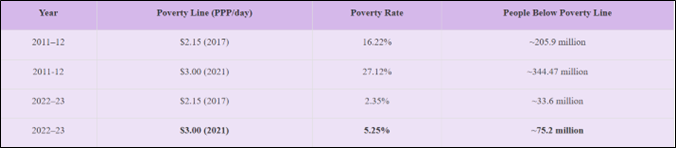
- Reduction of extreme poverty ($3/day) – India's extreme poverty fell from 27.1% in 2011–12 to 5.3% in 2022–23.
- The absolute number of people in extreme poverty dropped from 344.47 million to 75.24 million during this period.
- This implies nearly 270 million Indians were lifted out of extreme poverty in the past decade.
- LMIC category ($4.20/day) – India’s poverty rate fell to 23.9% in 2022–23, down from 57.7% in 2011–12.
- In absolute numbers, those below LMIC poverty line dropped from 732.48 million to 342.32 million.
- Rural and Urban Poverty Gap – LMIC poverty in Rural areas fell from 69% to 32.5%, urban from 43.5% to 17.2%.
- The gap declined from 25 to 15 percentage points, with a 7% annual fall.
World Bank’s multidimensional poverty index (MPI), non-monetary poverty in India declined from 53.8 percent in 2005-06 to 15.5 per cent in 2022-23.
The NITI Aayog has estimated that India’s population living in multidimensional poverty fell to 11.28 per cent in 2022-23 from 29.17 per cent in 2013-14.
What led to the significant drop in poverty in India?
- Improved household consumption data – Recent Household Consumption Expenditure Survey (HCES) 2023–24 showed higher household spending due to better design and inclusion of subsidised items.
- Welfare and subsidy schemes – Free foodgrains and government welfare schemes boosted basic consumption and reduced poverty.
- Strong rural consumption – Rural poverty fell sharply, and the rural-urban poverty gap narrowed due to targeted rural programs.
- Economic growth over the decade – Steady GDP growth improved incomes and created opportunities, helping people rise above poverty lines.
- Methodological updates and adjustments – New PPP-based global poverty lines provided more accurate and favourable comparisons for India.
- Frequent and transparent data publication – Regular surveys post-COVID improved tracking and reliability of poverty estimates.
What lies ahead?
- The data affirms India’s success in reducing extreme poverty by effective implementation of welfare schemes and inclusive growth policies.
- Updated metrics support better-targeted poverty alleviation programs.
- It Can aid in refining the National Multidimensional Poverty Index.
- India's poverty reduction achievements may bolster global development narratives.
|
Quick facts
|
|
The Household Consumption Expenditure Survey (HCES) 2023–24
- HCES – It is designed to collect information on consumption and expenditure of the households on goods and services.
- Nodal Ministry - Ministry of Statistics & Programme Implementation.
- In the latest Household Consumption Expenditure Survey India adopted Modified Mixed Recall Period (MMRP) method, replacing the outdated Uniform Reference Period (URP).
- In 2011–12, applying MMRP the poverty rate fell from 22.9% to 16.22%, even under the older $2.15 poverty line.
- In 2022–23, poverty under the new $3.00 line stood at 5.25%, while under the older $2.15 line it dropped further to 2.35%.
To know more about this, click here
|
Reference
- The Indian express| World Bank’s raised poverty line
- PIB| India’s Poverty Story Transformed