What is the issue?
The Central Statistics Office (CSO) and NITI Aayog recently released the back series detailing growth numbers for 2005-06 to 2011-12.
What is the report on?
- Back series calculations are done to link a new series of national accounts with an old series, for better comparison of growth over the years.
- The Central Statistics Office (CSO) moved to a new base year of 2011-12 from 2004-05 for national accounts, in January 2015.
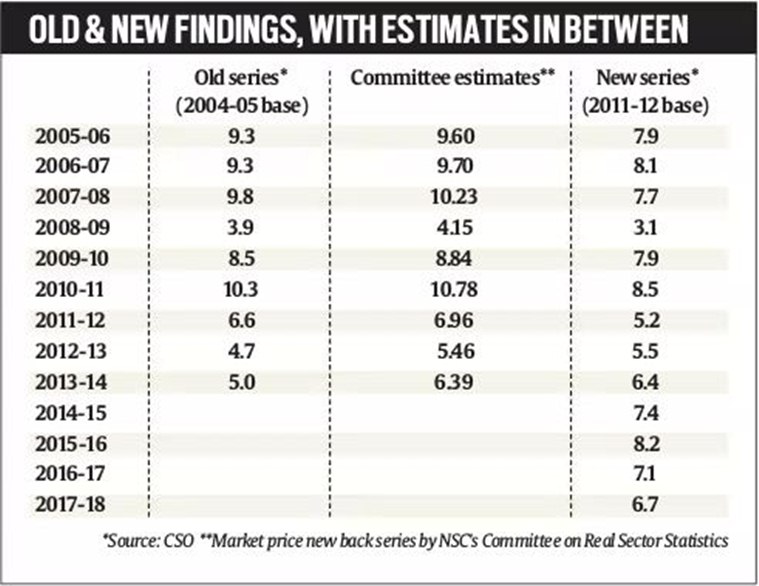
- A back series GDP data report was earlier released by an expert committee set up by National Statistical Commission (NSC). Click here to know more.
- There were differences of opinion on the methodology adopted for this calculation. Click here to know more.
- So the final back series data is now jointly released by the CSO and NITI Aayog.
What led to the complication in the earlier report?
- The CSO faced issues in evaluating GDP with the new base year for years preceding 2011-12 due to lack of availability of the MCA-21 database.
- MCA-21 is an e-governance initiative of the Ministry of Company Affairs launched in 2006.
- This was to allow firms to electronically file their financial results.
- With the shift to the new base year 2011-12, the CSO did away with Gross Domestic Product (GDP) at factor cost.
- It instead adopted the international practice of valuing industry-wise estimates as gross value added (GVA) at basic prices.
- Also, the MCA-21 database got used in addition to
- the volume index of Index of Industrial Production (IIP)
- establishment-based dataset of Annual Survey of Industries (ASI)
- So the calculation methodology was questioned, and the government termed the committee report 'unofficial'.
What are the highlights of the new report?
- The back series has trimmed the growth numbers for the UPA government’s two terms (2005-06 to 2008-09 and 2009-10 to 2013-14).
- Indian economy growth is recorded at an average 6.7% in UPA’s first term as well as the second term.
- [Significantly, these are lower than the earlier estimates of 8.1% and 7% respectively, with 2004-05 base.]
- These growth rates compare with an average 7.4% (2011-12 base year) in the first four years of the present NDA government.
- But the earlier report stated a faster growth under the UPA government from 2004-05 to 2013-14 than during the first four years of the current government.
- The new back series data released for years preceding 2011-12 scaled down growth rates for 2005-06 to 2013-14 by 0.8 to 2.1 percentage points.
- For 2012-13, with the new base year (2011-12), the GDP growth rate is revised upwards to 5.5% from 4.7% estimated earlier (2004-05 base year).
- Likewise, for 2013-14, the GDP growth rate was revised up to 6.4% from 5% estimated earlier.
- Sharp downward revisions were seen particularly for two years, 2007-08 and 2010-11.
- For 2010-11, the growth got revised downwards from a double-digit rate of 10.3% to 8.5%.
- The 8.5% cent growth in 2010-11 is the highest growth rate in the back series dating back to 2005-06.
What are the concerns?
- Data - The CSO release mentioned usage of several proxies.
- But there is not enough explanation for the choice of datasets and proxies, especially those datasets that did not exist before 2011-12.
- E.g. For years preceding 2006, when the MCA-21 database did not exist, the CSO has used Annual Survey of Industries (ASI) data for estimating manufacturing growth.
- But economists say there could have been other indicators for the same metric.
- Calculation - The current series is based on company data, MCA-21, which is the balance sheet data (financial).
- But the back series is based on volume data. E.g. the Annual Survey of Industries data for secondary sector
- The key difference between the volume index approach and the financial data approach is that the financial data captures changes in quality which volume data does not.
- So if a substantial part of the growth has been coming from quality, then the volume approach could have potentially underestimated growth.
- Institution - The CSO comes under the Ministry of Statistics and Programme Implementation (MoSPI).
- So the role of the NITI Aayog in the release of the statistical exercise has also been questioned as it goes against convention.
What could the implication be?
- During earlier instances of backcasting of GDP data, the political environment was not as deeply polarised as it is now.
- So the exercise remained more academic.
- But the present data show that India never really grew in double-digits in 2010-11.
- Also, India is projected not to be the high-growth economy in the five years preceding this as earlier thought to be.
- It so happens that this period covers the two terms of the Congress-led United Progressive Alliance government.
- The political influence in such professional data should seriously be taken note of by the policymakers, in long term interests.
Source: Indian Express, The Hindu
