What is the issue?
- India is currently witnessing a notable economic slowdown as reflected in the automobile slump and employment problems.
- In this context, boosting growth requires that attention be paid to both cyclical and structural dimensions of the problem.
What are the key factors behind?
- India’s current economic slowdown is due to a combination of two underlying trends.
- First, there is the short-run cyclical slowdown exhibited by a number of high-frequency indicators.
- There is a significant fall in demand, especially for sectors such as automobiles, consumer durables and housing.
- Second, there is the more serious long-term fall in investment and savings rates.
- Raising growth requires that attention be paid to both cyclical and structural dimensions of the problem.
How is the fixed capital formation scenario?
- The Gross Fixed Capital Formation (GFCF) relative to GDP at current prices has had a steady fall since 2011-12, when it was 34.3%.
- By 2017-18, it had fallen by 5.7% points, to a level of 28.6%.
- Assuming an Incremental Capital Output Ratio (ICOR) of 4, this meant a fall of nearly 1.4% points in the potential growth rate.
- [ICOR is the ratio of investment to growth; higher the ICOR, the lower the productivity of capital or the marginal efficiency of capital.]
- The fall consisted of sectoral decreases in the household, private corporate and public sectors.
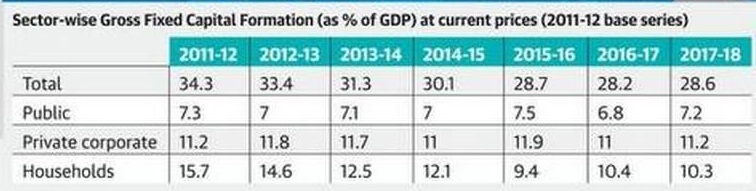
- Sectoral trend - The fall in the household sector’s investment rate got arrested by 2015-16.
- However, by then, the rate had already fallen by 6.3% points.
- From 2016-17, the sector’s investment rate even showed some recovery.
- In contrast to the household sector rate, the private corporate sector investment rate did not show any fall up to 2015-16.
- At 11.9% then, it was in fact higher than the corresponding rate for 2011-12 (11.2%).
- It fell in the subsequent years, but only by 0.7% points.
- In the case of the public sector, the rate fell by 0.3% points between 2015-16 and 2017-18.
- Thus, the period from 2011-12 to 2017-18 can be seen as consisting of two parts:
- 2011-12 to 2015-16, when the household sector investment rate fell sharply
- 2015-16 to 2017-18 when the investment rates of the private corporate and public sectors fell marginally
What is the case with the savings rate?
- The Gross Domestic Savings Rate fell between 2011-12 and 2017-18 by 4.1% points, from 34.6% of GDP to 30.5%.
- However, this fall was entirely due to the household sector.
- The private corporate and public sectors show increases in their savings rates by margins of 2.2% points and 0.2% points, respectively.
What is the overall implication?
- This differentiated sectoral pattern of investment and savings rates had significant implications for the financing of investment.
- Private corporate and public sectors were the deficit sectors.
- They usually financed their deficits from the surplus savings of the household sector.
- In addition, net inflow of foreign capital added to the flow of investible resources.
- But throughout the period from 2011-12, the savings rate of the private corporate sector increased.
- This reduced its dependence on the surplus savings of the household sector.
- The excess of private corporate sector’s investment over its own savings rate was 3.8% points of GDP in 2011-12.
- [However, this gap fell to 0.5% points by 2017-18.]
- Given this pattern, private corporate sector’s investment demand can be largely met by its own savings.
- So, at present, all the surplus savings of the household sector is available for the public sector.
- Public sector’s borrowing requirements can be fully financed using the surplus from the household sector.
- This can safely be supplemented by net inflow of foreign capital without any fear of crowding out.
What is the key priority now?
- In 2018-19, the real GDP growth rate was 6.8%.
- Two critical policy challenges need to be addressed.
- First, a countercyclical policy should increase growth rate to its current potential of 7%-7.5%.
- After this, structural reforms should raise the potential growth itself to above 8.5%.
- These are essential for India to attain a size of $5 trillion by 2024-25.
How then should expenditure be managed?
- From the monetary side, reducing the repo rate by a cumulated margin of 110 basis points in 2019 has not as yet induced a noticeable growth response.
- Given this, complementary fiscal stimulus, in the form of additional public sector investment, may prove to be more effective.
- However, given the fiscal deficit constraint, there is limited flexibility for increasing centre’s capital expenditure directly.
- There may be some expansion, if additional dividends from the Reserve Bank of India (RBI) flow to the government.
- Further, there may be some possible additional disinvestment.
- However, care should be taken to deploy all of these additional funds for capital expenditure.
- Caution - Normally, the prescription to meet slowing demand is to increase government expenditure.
- In the current situation, increase in government expenditure has to be directed towards an increase in investment expenditure.
- A similar effort may be made by State governments and non-government public sector enterprises to increase capital expenditures.
- All these measures may also crowd in private investment.
- Thus, this fiscal push, together with the already-initiated monetary stimulus, may help raise the growth rate.
- Another area that needs immediate attention is the financial system, which must be activated to lend more.
What are the much-needed structural reforms?
- Structural reforms are now a key priority to push the economy onto a sustained high growth path.
- On the fiscal account, there has to be a re-look at the Fiscal Responsibility and Budget Management (FRBM) Act.
- The government should actually move towards reducing the revenue deficit to zero.
- This can happen if the Centre focuses more on items on the Union list.
- Once this is achieved, the Central Government will have the freedom over fiscal deficit, as the entire deficit will be directed towards meeting capital expenditures.
Source: The Hindu
Quick Fact
Gross Fixed Capital Formation (GFCF)
- GFCF is essentially the net investment; it measures the net increase in fixed capital.
- It is a component of the Expenditure method of calculating GDP.
- Gross fixed capital formation includes -
- spending on land improvements
- plant, machinery, and equipment purchases
- the construction of roads, railways, private residential dwellings, and commercial and industrial buildings
